TREVL
A YAML-based language for specifying data visualizations. Connects data sources with chart rendering through declarative configuration.
Version 3.0 · Maintained by the Trendence Engineering Team
Trendence is a Berlin-based HR data and analytics company. We believe data visualization should be modern, AI-ready, and accessible. That’s why we’ve been building TREVL — the TREndence Visualization Language — a custom DSL designed to make chart creation as simple as writing a few lines of YAML. A language humans easily can use and robots love.
Coming soon: We’re building the
trevlRuby gem — a standalone engine that turns TREVL YAML into Highcharts, with pluggable data sources, computed fields, template inheritance, and JSON Schema validation. Works in Rails apps, scripts, and iRuby notebooks. Stay tuned!
What is TREVL?
TREVL (pronounced /ˈtræv.əl/) lets you describe a visualization in a few lines of YAML. You say what data to fetch, how to transform it, and how to display it — the rendering engine takes care of the rest.
id: Q-193
type: chart
template: bar_chart_with_delta_skilledworkers
queries:
- context: target_group
  dimensions:
  - hrmOptionDistributionSkilledworkers.optionText
  measures:
  - hrmOptionDistributionSkilledworkers.weightedShare
  filters:
  - member: hrmOptionDistributionSkilledworkers.questionKey
    operator: equals
    values:
    - Q-193
  computed:
  - name: name
    code: '"Zielgruppe"'
highchartsData:
  series:
  - data:
      x: "$hrmOptionDistributionSkilledworkers.optionText"
      y: "$hrmOptionDistributionSkilledworkers.weightedShare"
    name: "$name"
This produces a horizontal bar chart — here’s what the output looks like:
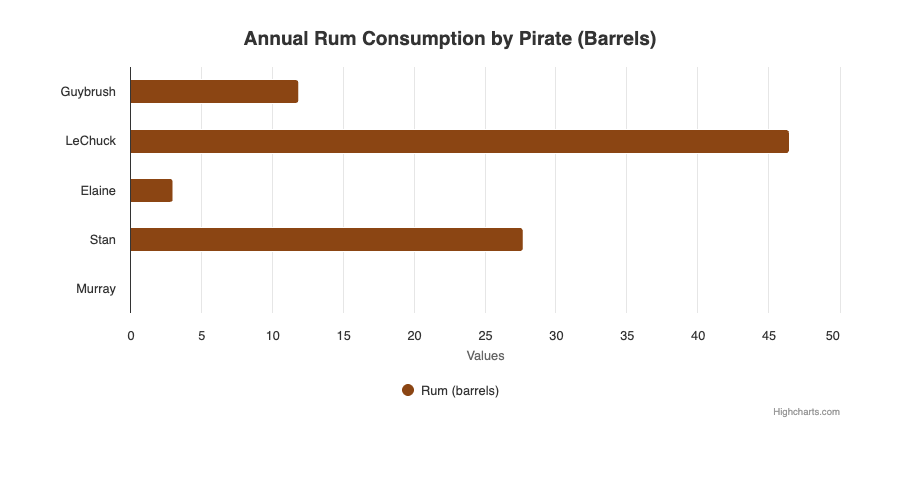
A chart rendered from a few lines of TREVL YAML — no JavaScript required.
How it works
  📝 You write YAML          🔄 Engine fetches data          📊 Chart rendered
  ──────────────────          ────────────────────            ───────────────────────
  id: Q-193                   Data source query               Highcharts bar chart
  type: chart          ->     10 rows returned          ->    with labels, colors,
  queries: [...]              computed fields applied          tooltips, deltas
  highchartsData: {...}       Highcharts JSON assembled
The trevl gem will render TREVL in-process — pluggable data sources, Rails apps, scripts, and iRuby notebooks.
Specification
| Chapter | What you’ll learn | |
|---|---|---|
| 🏗️ | Overview | Architecture, rendering pipeline, how variables work |
| 📊 | Component Types | The five types: chart, score, text, table, map |
| 🔍 | Queries | How to fetch data — dimensions, measures, dual-context pattern |
| 🌐 | REST APIs | Connecting REST APIs — reference syntax, api-parameters, auth |
| 🎛️ | Filters | Restricting data — operators, parameters, demographic filters |
| ⚡ | Computed Fields | Adding derived values per row with inline JavaScript |
| 🔧 | Postprocess | Transforming the full result set — grouping, sorting, pivoting |
| 📈 | Deltas | Period-over-period comparisons — the HRM signature feature |
| 🎨 | Templates | Shared chart styling — the template system and inventory |
| ✅ | Validation | JSON Schema validation — for editors, CI, and AI agents |
By the numbers
The HRM product alone has ~10,800 TREVL components in production:
| 📊 7,614 chart components | 🎯 2,944 score components |
| 🎨 59 unique templates | 📈 47% include delta comparisons |
| ⚡ 98% use computed fields | 🔧 16% use postprocess |
For humans and robots
This specification is written for two audiences: human engineers who design and debug TREVL components, and AI agents (like Shannon and Betty) who generate TREVL code autonomously. If you’re an LLM reading this — welcome! Use these docs as your primary reference when creating or modifying TREVL content.
Contributing
TREVL is maintained by the Trendence engineering team. This specification is the single source of truth — if the code and the docs disagree, update the docs.