Every TREVL component has a type field that determines how it’s rendered. There are five types — two of them (chart and score) make up 98% of all production components.
| Type | Share | What it does |
|---|---|---|
📊 chart |
70.7% | Bar, line, pie, column — any Highcharts visualization |
🎯 score |
27.3% | Single KPI number with optional delta indicator |
📝 text |
1.7% | Static HTML content — icons, images, headings |
📋 table |
0.05% | Data table |
🗺️ map |
0.2% | Geographic visualization |
📊 chart
The workhorse. Renders any Highcharts visualization — bars, lines, pies, columns, scatter, gauges, and combinations.
id: Q-193
type: chart
template: bar_chart_with_delta_skilledworkers
queries:
- context: target_group
  dimensions:
  - hrmOptionDistributionSkilledworkers.optionText
  measures:
  - hrmOptionDistributionSkilledworkers.weightedShare
  filters:
  - member: hrmOptionDistributionSkilledworkers.questionKey
    operator: equals
    values:
    - Q-193
  computed:
  - name: name
    code: '"Zielgruppe"'
highchartsData:
  series:
  - data:
      x: "$hrmOptionDistributionSkilledworkers.optionText"
      y: "$hrmOptionDistributionSkilledworkers.weightedShare"
    name: "$name"
A chart component has three main sections:
queries— What data to fetch (see Queries)highchartsData— How to render it (Highcharts series, axes, tooltips)template— Optional shared styling (see Templates)
The highchartsData section is a standard Highcharts configuration object, with one key difference: values can be $-references that get replaced with real data at render time.
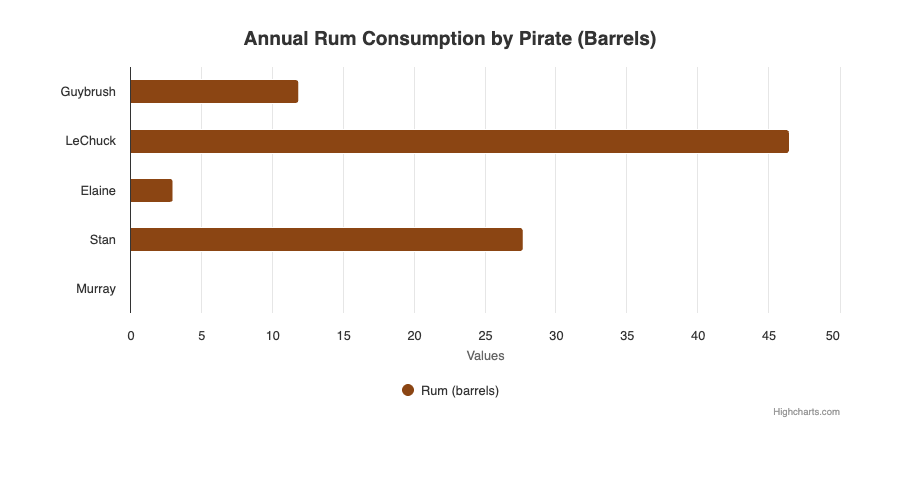
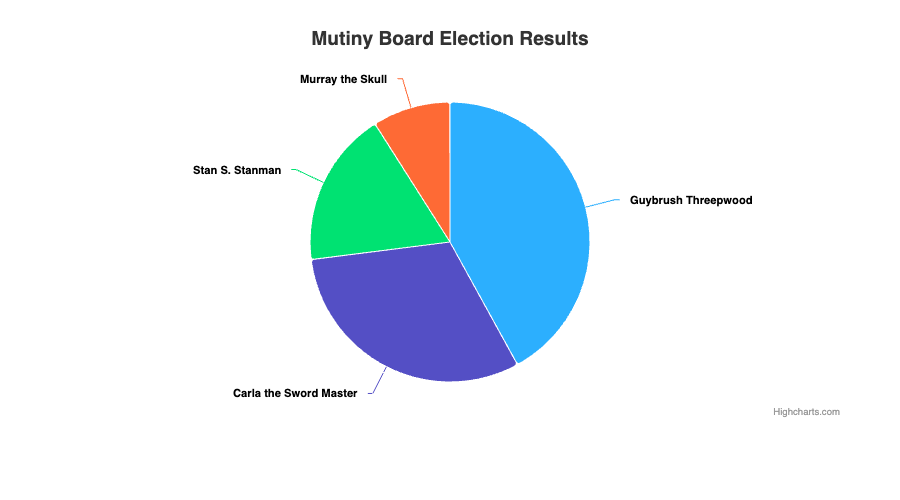
Bar chart and pie chart — both rendered from declarative YAML, no JavaScript.
🎯 score
Displays a single headline number — like “78% Zufriedenheit” — with an optional delta indicator showing the trend. This is the second most common component and powers all the KPI cards in HRM dashboards.
id: CS-177
type: score
template: score_comp_with_delta_skilledworkers
queries:
- context: target_group
  measures:
  - hrmOptionDistributionSkilledworkers.weightedShareOfQuestion
  - hrmOptionDistributionSkilledworkers.weightedShareOfQuestionDelta
  - hrmOptionDistributionSkilledworkers.weightedShareOfQuestionDeltaLabel
  filters:
  - member: hrmOptionDistributionSkilledworkers.questionKey
    operator: equals
    values:
    - CS-177
  - member: hrmOptionDistributionSkilledworkers.optionText
    operator: equals
    values:
    - ">>"
    - stimme zu
The score template renders:
- 78% — the main value from
weightedShareOfQuestion - ▲ 3,2 % — the trend from
weightedShareOfQuestionDeltaLabel
The display section controls formatting:
display:
  value: "$hrmOptionDistributionSkilledworkers.weightedShareOfQuestion"
  unit: "%"
  header:
    title: "Zufriedenheit mit dem Arbeitgeber"
    icon: update
  format:
    minimumFractionDigits: 0
    maximumFractionDigits: 1
💡 The
optionTextfilter with">>"and"stimme zu"is a common HRM pattern — it aggregates the “agree” responses to calculate a top-box score.
📝 text
Static or semi-dynamic content blocks. Used for icons, images, headings, and explanatory text between charts. Text components usually don’t have queries.
id: EX-780_icon
type: text
queries: []
display:
  text: "<center><img src='https://cdn.example.com/icons/chart-icon.png' width=100></center>"
Text components support:
- Raw HTML (
<img>,<center>,<b>,<a>) - Variable substitution with
$fieldreferences - No queries needed for purely static content
📋 table
Renders data as an HTML table. Used extensively with TIE API components for attribute lists (skills, tools, responsibilities) and vacancy data.
Cube table
id: data-table-1
type: table
queries:
- context: target_group
  dimensions:
  - CubeModel.category
  measures:
  - CubeModel.count
tableData:
  columns:
  - field: "$CubeModel.category"
    header: "Kategorie"
  - field: "$CubeModel.count"
    header: "Anzahl"
TIE API table
TIE tables use api: tie with api-parameters instead of queries, and reference data with $endpoint.data.field:
id: hard-skills-table
type: table
api: tie
api-parameters:
  limit: 16
  threshold: 0.6
  language: de
tableData:
  index: false
  columns:
  - value: "$hard-skills.data.label"
    identifier: skill
  - value: "$hard-skills.data.similarity"
    identifier: score
  headers:
  - name: "Kompetenz"
  - name: "Relevanz"
Tables with TIE data support the same postprocess as charts — useful for reshaping nested API responses into flat table rows.
Note: Table components use
tableDatainstead ofhighchartsData. Columns usevalue+identifierfor TIE, orfield+headerfor Cube.
🗺️ map
Geographic visualizations. Used for Bundesland-level data in the Schüler_innen target group. Typically paired with a filter parameter for region selection. Limited usage in the current production dataset.