Computed fields are the Swiss Army knife of TREVL. They add derived values to each data row after the query executes — labels, colors, formatting, conditional logic, you name it. They run as JavaScript expressions, so anything you can write in one line of JS, you can use here.
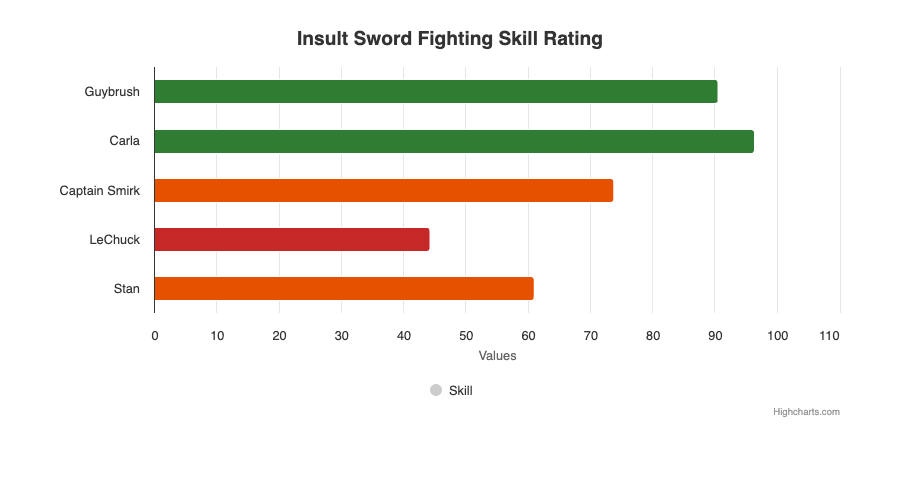
Conditional coloring via computed fields: green (>80), orange (>50), red (<50) — all defined in YAML.
Almost every component uses them: 98.4% of HRM components have at least one computed field.
📋 Syntax
computed:
- name: fieldName
  code: 'expression'
- name: fieldWithArgs
  arguments:
    argName: "$cube.dimension"
  code: 'argName + " suffix"'
🧩 Patterns
1. String Constants
Most common. Assigns a fixed label, color, or config value.
computed:
- name: name
  code: '"Zielgruppe"'
- name: color
  code: '"#003F85"'
- name: pointPaddingInfo
  code: '0.1'
- name: zIndexInfo
  code: '2'
- name: showInLegend
  code: 'true'
- name: innerSizeInfo
  code: "'50%'"
2. Pass-Through with Arguments
Passes a query field through, optionally renaming it:
computed:
- name: delta_label
  arguments:
    delta_label: "$hrmOptionDistributionSkilledworkers.weightedShareDeltaLabel"
  code: delta_label
3. Template Literals
JavaScript template literals for formatted strings:
computed:
- name: compare_label
  arguments:
    period: "$hrmOptionDistributionSkilledworkers.periodCompare"
  code: "`Vergleich zu ${period}`"
4. String Manipulation
Date formatting, truncation:
computed:
- name: dateFormatted
  arguments:
    date: "$HrmScholarBundesland.stichtag"
  code: date.substring(0,4)
5. Conditional Logic
Multi-line JavaScript with if/else:
computed:
- name: y
  arguments:
    weightedShare: "$cube.weightedShare"
    optionText: "$cube.optionTextRecoded1"
  code: |-
    let y;
    if (optionText === "Stimme zu") {
      y = -(weightedShare);
    } else {
      y = weightedShare;
    };
    y
6. Axis Index Assignment
For charts with multiple y-axes (e.g., line charts with two series on different scales):
# First query (left axis)
computed:
- name: yAxisIndex
  code: '0'

# Second query (right axis)
computed:
- name: yAxisIndex
  code: '1'
Referenced in series: yAxis: "$yAxisIndex"
7. Explicit x/y Mapping
When the series data template needs explicit control:
computed:
- name: x
  arguments:
    x: "$dateFormatted"
  code: x
- name: y
  arguments:
    y: "$HrmScholarBundesland.bewerber"
  code: y
💡 How Arguments Work
The arguments map binds query result fields to local variable names in the code expression:
arguments:
  localVarName: "$cube.dimensionOrMeasure"
- The
$cube.fieldreference is resolved to the actual value from the current data row - The value is passed to the JavaScript expression as
localVarName - Without arguments,
codehas no access to row data (only literals)
🔄 Execution Order
- Query returns rows
- For each row, computed fields are evaluated in order
- Earlier computed fields are available to later ones (via
$fieldName) - Final row = original fields + all computed fields
- Postprocess runs after all rows have computed fields
📦 Common Computed Field Sets by Template
bar_chart_with_delta
computed:
- name: pointPaddingInfo   # 0.1 for target, -0.2 for compare
- name: zIndexInfo         # 2 for target, 1 for compare
- name: name               # "Zielgruppe" or "Vergleichsgruppe"
- name: delta_label        # Pass-through of deltaLabel measure
- name: compare_label      # "Vergleich zu Jul 24"
score_comp_with_delta
computed: []  # Scores typically don't need computed fields
              # (the template handles formatting)
pie_chart
computed:
- name: labelcolor         # Color for data labels
- name: innerSizeInfo      # "50%" for target (donut), "40%" for compare
- name: showInLegend       # true for target, false for compare
- name: optionText         # Pass-through for category names
line_chart
computed:
- name: dateFormatted      # Extract year from date string
- name: yAxisIndex         # Which y-axis (0 = left, 1 = right)
- name: x                  # Explicit x value
- name: y                  # Explicit y value
- name: name               # Series name
- name: color              # Series color